Harper Krause · 8 October 2026
Tracking Server Response Variations with Beampier During Seasonal Traffic Spikes Across Global CDNs
Seasonal traffic spikes place measurable pressure on content delivery networks that operate across continents, and tools like Beampier provide structured log analysis to capture response time fluctuations at each edge location. Observers note that October 2026 saw early retail preparation periods generate elevated request volumes in North America and Europe, while similar patterns emerged in Asia-Pacific regions tied to regional shopping events. Beampier ingests raw server logs from distributed CDN endpoints, then correlates timestamped response codes with geographic origin data to reveal where latency increased or error rates shifted.
Mapping Global CDN Infrastructure Under Load
Content delivery networks rely on hundreds of points of presence that cache and serve assets closer to end users, yet seasonal demand surges can expose differences in cache hit ratios and backend fetch times across those nodes. Data from industry reports shows that traffic volume can rise between 40 and 120 percent above baseline during peak weeks, depending on the region and content type. Beampier processes these logs by grouping entries according to CDN provider, server identifier, and response status, which allows analysts to isolate variations that occur when one region experiences a sudden request increase while another remains stable.
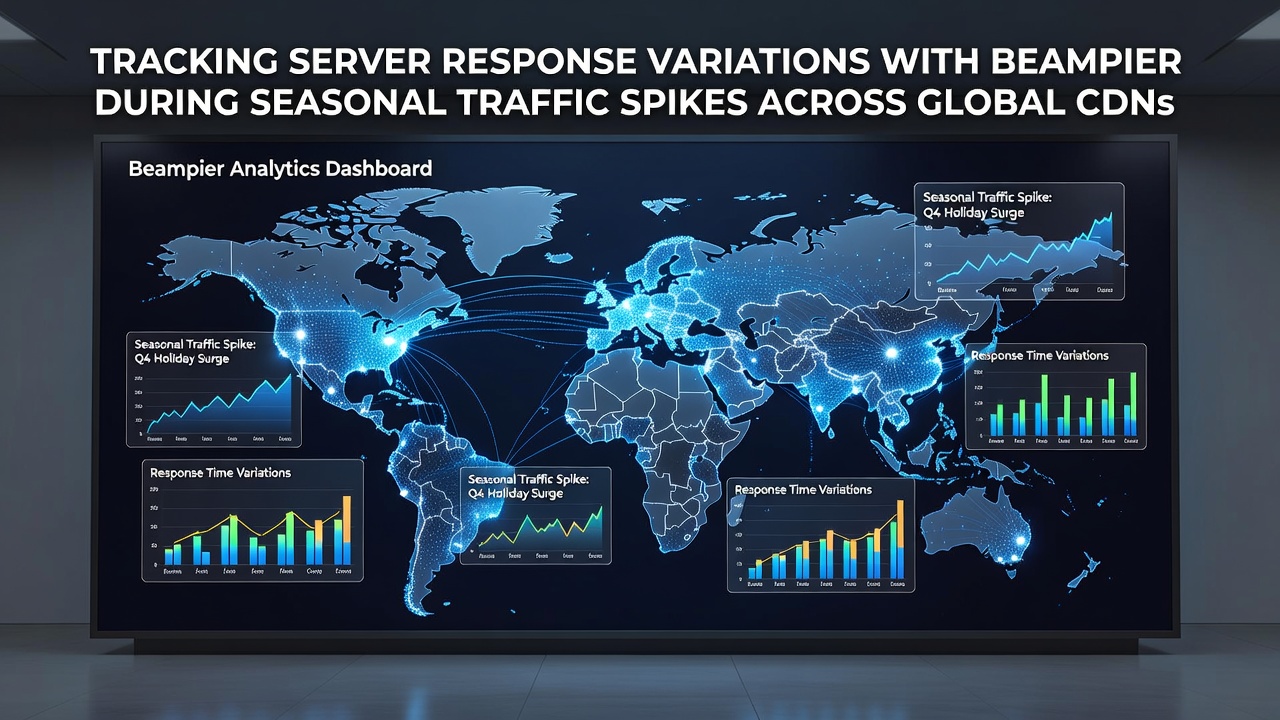
Researchers have documented that European CDNs often register longer tail latencies during October events compared with North American counterparts, largely because of differing peering agreements and transit routes. Beampier visualizes these patterns through time-series charts that overlay response distributions from multiple providers, making it straightforward to compare Akamai, Cloudflare, and Fastly performance within the same dashboard view. Those who have examined such overlays find that response code 304 counts climb steadily when cache validation requests dominate, while 5xx errors appear in clusters tied to specific origin server overloads.
Log Correlation Techniques for Response Analysis
Beampier applies filtering rules that segment logs by HTTP method, content type, and client ASN before calculating percentile response times for each segment. This segmentation reveals whether image or video requests drive the majority of delays during a spike, or whether API endpoints experience different scaling behavior. Studies from academic sources indicate that combining log timestamps with BGP route announcements helps identify when traffic rerouting contributes to elevated round-trip times across borders.

Analysts configure Beampier to flag response variations that exceed three standard deviations from a seven-day rolling mean, then drill into the underlying log lines to locate the affected edge servers. The tool exports these flagged events with associated metadata, including cache status and origin fetch duration, so teams can trace whether a slowdown originated in the CDN layer or further upstream. Evidence from multiple deployments demonstrates that this approach surfaces regional discrepancies faster than manual log grepping across separate provider consoles.
Seasonal Patterns Observed in October 2026
Traffic data collected during October 2026 illustrated how pre-holiday inventory updates adn promotional campaigns produced distinct response signatures across time zones. Beampier timelines showed North American edges encountering higher 404 rates on product pages that had not yet been pre-cached, while Asian edges recorded sustained increases in 200 responses once regional promotions began. The platform aggregates these outcomes into comparative tables that list median and 95th-percentile latencies per provider and continent, giving operations teams a consolidated view without switching between multiple monitoring portals.
External research published by the Asia-Pacific Network Information Centre highlights that intercontinental latency variance widens during synchronized global campaigns, and Beampier users have replicated those findings by aligning their own log exports with publicly available measurement datasets. The correlation process involves matching Beampier-derived event windows with route collector data, which clarifies whether a response variation stems from routing changes or from local cache eviction policies under load.
Practical Implementation Steps
Teams begin by directing CDN access logs into Beampier through secure ingestion endpoints, then define baseline periods that exclude known promotional dates. Once baselines exist, the system calculates dynamic thresholds that adjust automatically as traffic patterns evolve. Users add custom tags for seasonal campaigns so that later queries can isolate response metrics tied to specific marketing initiatives. Reports generated this way include both tabular summaries and annotated graphs that export directly into existing incident management workflows.
Additional configuration options allow Beampier to cross-reference response codes against origin server CPU and memory counters when those metrics are forwarded through compatible agents. This combined dataset helps distinguish between CDN-level saturation and origin bottlenecks during the same traffic event. Observers note that organizations running parallel CDN deployments gain the most from these cross-provider comparisons because Beampier normalizes field names and units across different log formats.
Conclusion
Beampier supplies a centralized method for quantifying server response variations that appear when seasonal demand tests the capacity of global content delivery networks. By processing timestamped logs from multiple providers and regions, the platform produces comparable metrics that highlight where and when performance diverges. October 2026 data sets demonstrated the value of this approach through clear visualizations of regional latency shifts and error clustering. Continued refinement of log correlation rules and threshold logic supports ongoing monitoring as traffic patterns change with new seasonal cycles.